
Navigating the Mapping Canvas
Mappings · Updated August 26, 2025
Introduction
This document provides a comprehensive guide to navigating the Mappings interface within Reactor Data. The Mappings interface is where users define data transformations and configure data flow within the Reactor Data platform. This guide will walk you through accessing the Mappings page and understanding its components.
Prerequisites
Before you begin mapping data, ensure that you have completed the following:
-
Connect Data Sources: Establish connections to all data sources required for your mapping activities. For detailed instructions, refer to the "Connect to a Data Source" documentation.
-
Standardize Source Data: Standardize the data from your connected data sources to ensure consistency and quality. For detailed instructions, refer to the "Standardize Your Source Data" documentation.
-
(Optional) Configure Source Links: If you need to combine data from multiple sources, configure Source Links to define how the data should be joined. For detailed instructions, refer to the "Source Links" documentation.
Accessing the Mappings Page and Configuring The Mapping Canvas
Select the Mappings link on the left sidebar to access the Mappings interface.
Once you have navigated to the Mappings page, you will see a blank screen with instructions to search for and/or pin a source or model using the Search bar at the top-right corner of the page. By pinning sources and models, you can customize your view of the Mappings canvas and focus on the data sources, transformations, and outputs that are important to you.
How Pins Work
When you pin an object, all related objects directly connected to it are also pinned to the canvas, giving you a focused, relevant view of that specific pipeline segment.
- Pin a Model: This will also display any sources and outputs connected to that model, as well as any other models connected to it.
- Pin a Source: This will display all downstream models and outputs connected to that source.
You can pin as many sources and models as you want, and all objects you have pinned will be displayed as tiles in a ribbon above the canvas and will persist across sessions, so your view is ready for you the next time you log in. You can easily unpin any object by selecting the ❌ icon in its tile on the ribbon.
Overview of the Mappings Interface
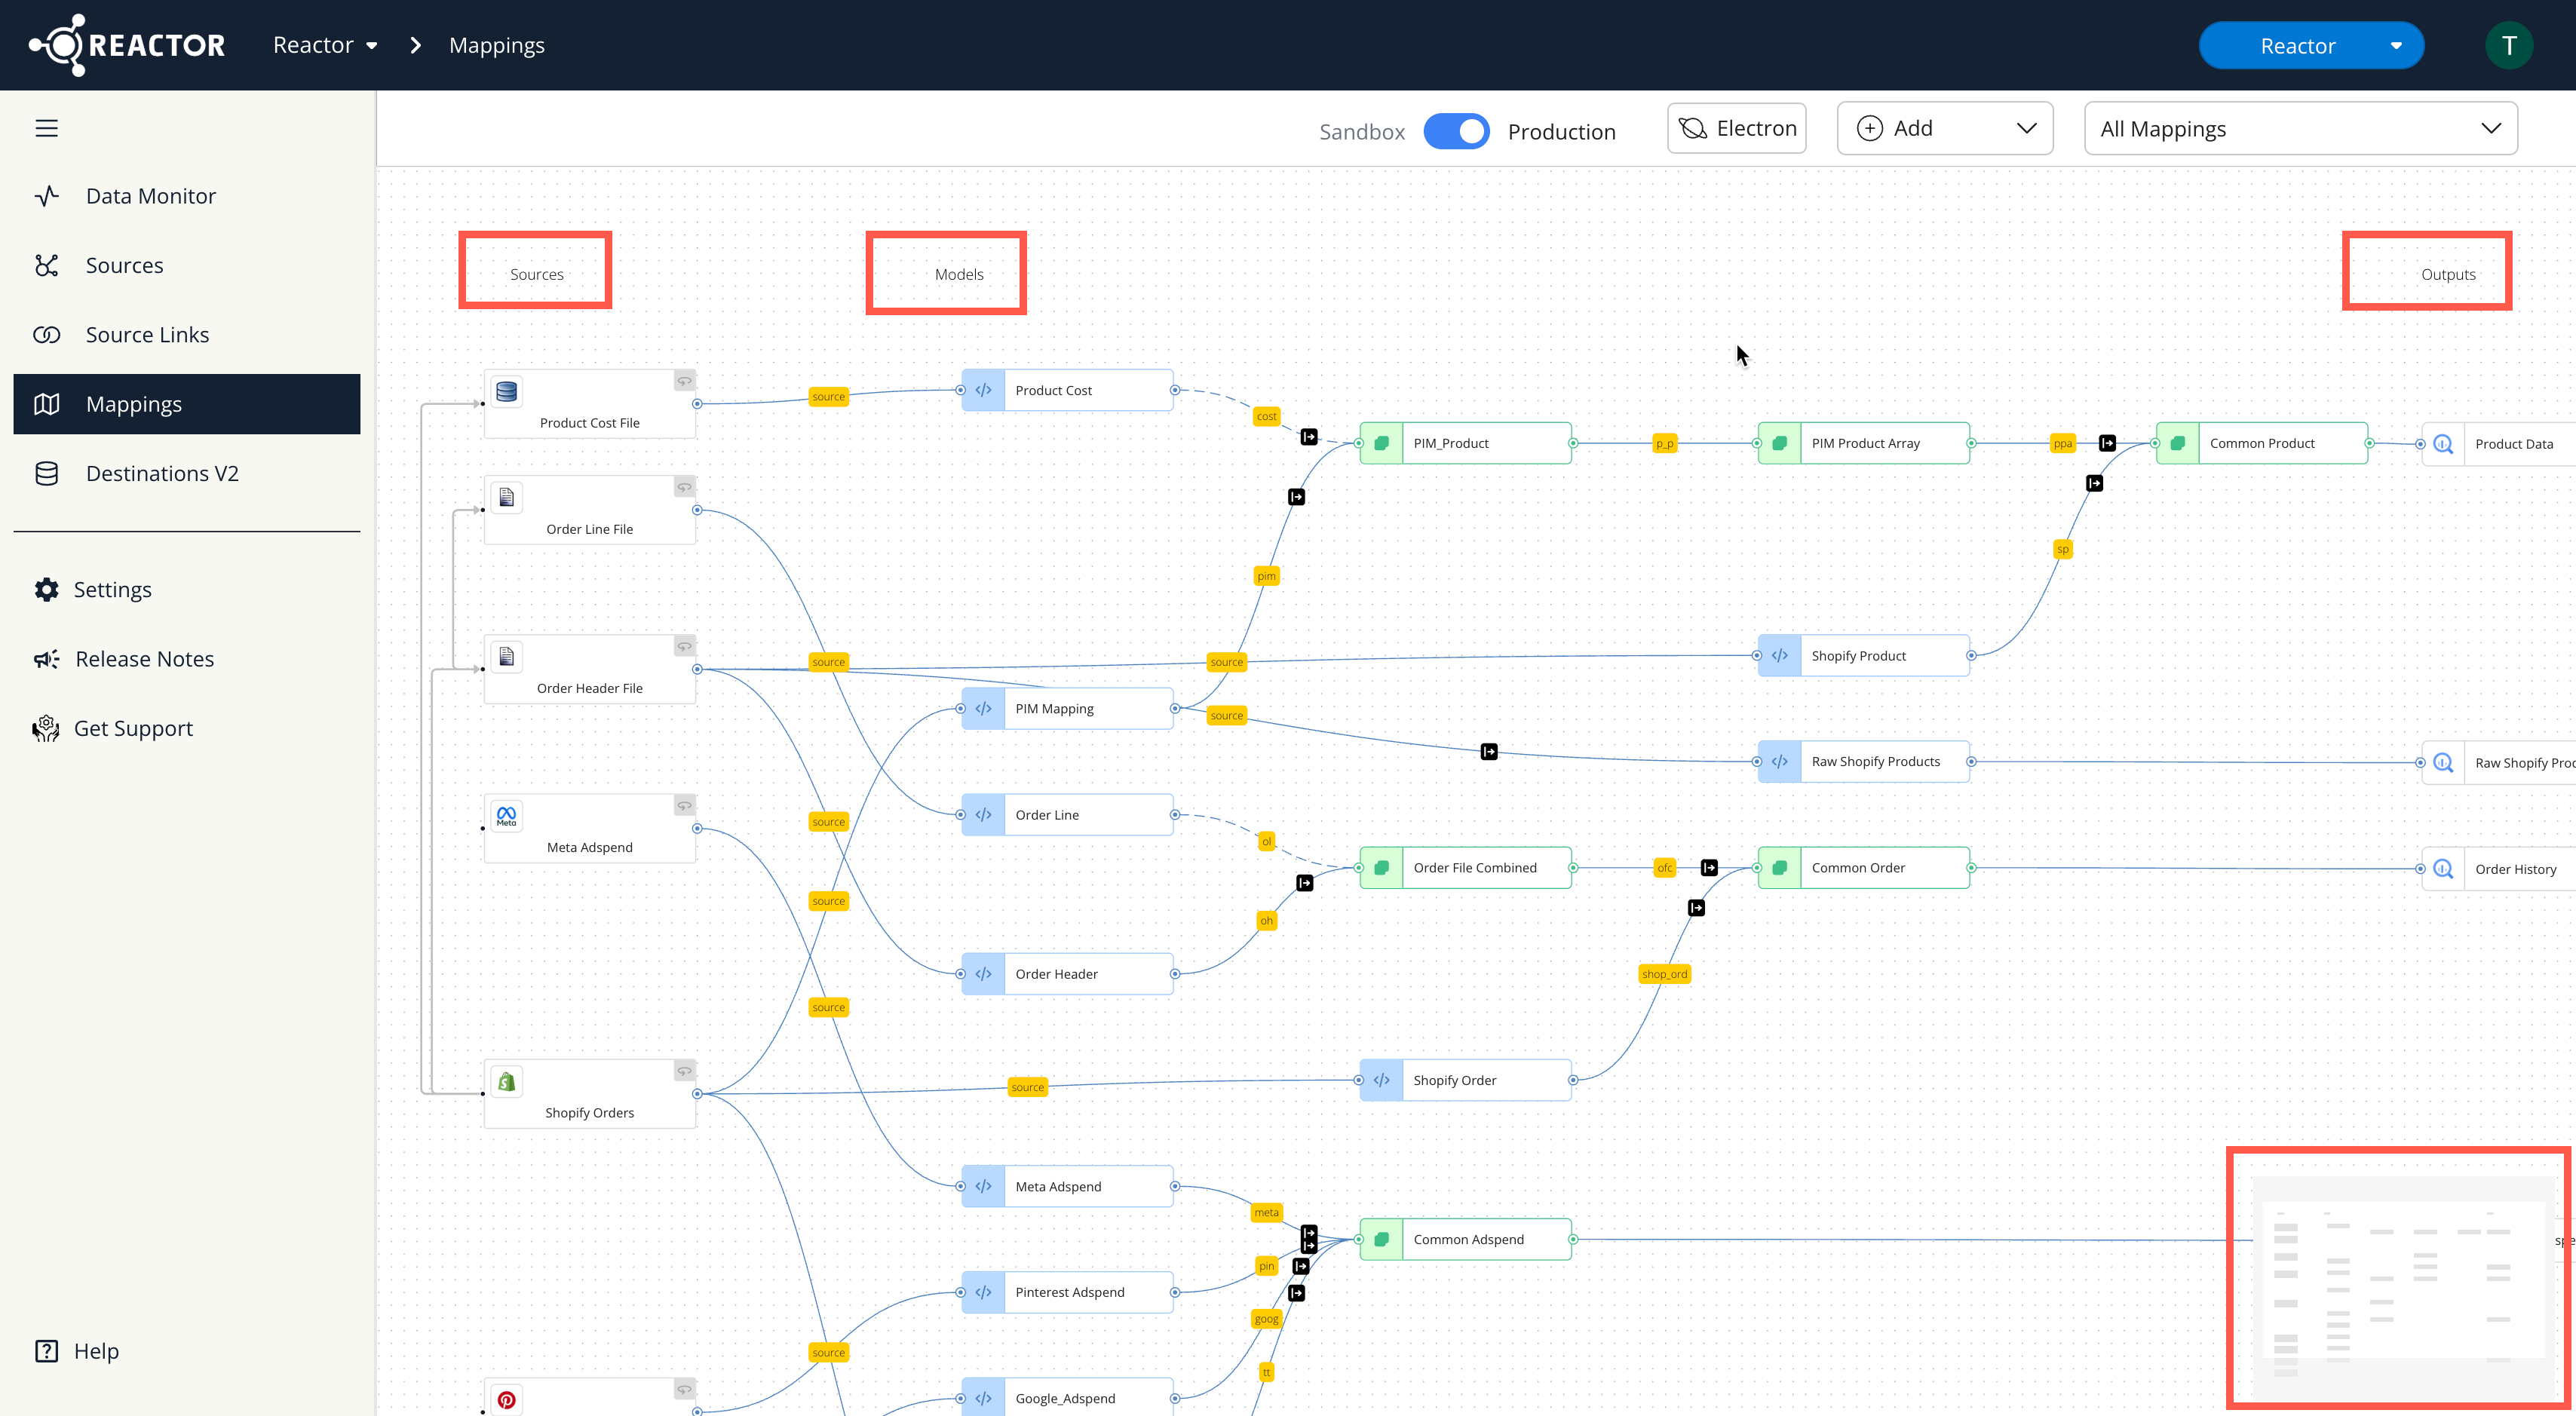
The Mappings interface visually represents your data flow using a graph. This graph consists of several key components:
-
Data Sources:
- Represented by white boxes on the left side of the graph.
- These are the sources from which data is ingested into Reactor.
-
Models (Mapping Configurations):
- Represented by white boxes in the middle of the graph.
- Models define how data is transformed and mapped.
- There are two types of model configurations:
- Source Mapping Configurations (Blue Outline): Map data from a source to a semantic model output.
- Semantic Model Mapping Configurations (Green Outline): Map data from a semantic model to a new model output.
- For more information about Semantic Models, refer to the Reactor Data documentation on Semantic Models.
-
Edge Configurations:
- Represented by yellow boxes located immediately upstream of any mapping configuration.
- Edge configurations define the flow of data and how fields are passed between sources, models, and outputs.
-
Output Configurations:
- Represented by white boxes with a database icon on the right side of the graph.
- Output configurations specify the destination for the transformed data (e.g., a table in a data warehouse).
The graph is organized with headers for Sources, Models, and Outputs at the top.
ℹ️ You can quickly scroll through the canvas using the mini-map on the lower right side of the canvas.
Data flows from left to right through the canvas graph, connecting sources, semantic models, and outputs via edges. Edge configurations are present at each step in the data pipeline, up to the final semantic model configuration before an output.
Common Data Path
A typical data path in the Mappings interface includes the following sequence:
- Data Source: The origin of the data.
- Source Mapping Configuration: Defines how data from the source is mapped to a semantic model.
- Semantic Model Configuration: Adds derived semantic labels and refines the upstream source mapping configuration data.
- Output Configuration: Specifies the destination in the data warehouse (e.g., Snowflake or BigQuery) where the transformed data will be exported.
However, this is just one example; the Mappings interface supports various data path configurations.
ℹ️ For more information on data paths, see the Using the Semantic Layer in Reactor help article.
Interface Controls
-
Adding Models and Outputs:
To create a new model or output, select the ➕Add icon next to the top of the canvas between the Electron icon button and the All Mappings drop-down and search.
ℹ️ For details on creating mapping configurations, see the How to Create a Mapping Configuration documentation.
ℹ️ For details on creating output configurations, see the Creating Data Outputs in the Mapping Canvas documentation.
-
Searching Configurations:
A search box is located at the top right of the graph "All Mappings" drop-down, enabling users to search for specific configurations by name.
Sources
All source connectors deployed on the Sources page are displayed on the mapping graph.
ℹ️ For more information on connecting to data sources and configuring source data,
see the "Connect to a Data Source" documentation.
Understanding Models (Mapping Configurations)
To view the details of a model: click on the box representing that model on the graph.
ℹ️ If you need assistance locating a specific model, use the search box at the top right of the mapping graph.
Clicking on a mapping configuration opens the Mapping Configuration Editor at the bottom of the screen. The rest of the screen displays the entire data path in which the configuration is included.
Mapping Configuration Editor Components
The Mapping Configuration Editor is organized into the following components:
-
Header:
- Located at the top of the Mapping Configuration Editor.
- Includes:
- Settings Icon: Opens a popup to edit the model's settings.
- Deploy Icon: Deploys any changes made to the mapping configuration.
- Size Selector: Allows users to adjust the height of the Mapping Configuration Editor (25%, 50%, 75%, 100% of the screen).
- Close Button: Exits the Mapping Configuration Editor and returns to the mapping graph.
-
Resizing the Mapping Configuration Editor
- To minimize any boxes within the configuration editor, click the ⏪ icon at the top right of that box.
- To adjust the overall height of the Mapping Configuration Editor, use the size toggles located at the top-right of the editor.
-
Source Data Box:
- Located on the left.
- Displays a sample source record and allows users to select different source records to preview.
- Also shows any source-linked records associated with the selected record, with each linked record appearing in a separate tab above the source document JSON.
*For information on source links, see "Source Links" documentation.*
-
Model Mappings Box:
- Located in the center.
- Contains a table displaying all fields in the output semantic model and other metadata related to the configuration.
-
Mapping Results Box:
- Located on the right.
- Provides a preview of the source record (displayed in the Source Data box) after the transformations defined in the model mappings are applied.
Previewing Source Records and Transformation Results
- To preview a specific source record and its transformed output, enter the record's globally unique identifier in the "Unique ID" text box in the Source Data section.
- This "Unique ID" typically corresponds to the field designated as the Globally Unique field in the source connector's Data Standard. (See the "Standardize Your Source Data" documentation for more details.)
- If multiple sources feed the model, ensure the correct source is selected in the dropdown menu above the "Unique ID" text box.
-
If a source has multiple fields configured as "Together Globally Unique" in its Identity Setup, the Globally Unique ID value for a given record can be found by searching for the
scidcolumn in the Data Warehouse and removing all characters up to and including the hyphen in thescidstring. For example, a record with anscidof2:Facebook:Reactor:adspend:kind:Reactor-d9232720b8896e7aecdb1d861a47c0bahas a Globally Unique ID value ofd9232720b8896e7aecdb1d861a47c0ba.
-
Model Mappings Table Columns
The Model Mappings table within the Mapping Editor displays the following columns:
- Field Name: The name of the transformation field.
- Type: The transformation type (e.g., Single Value, Local Variable, Object Field, or Array of Objects).
- Description: An editable description of the field.
Model Mappings Table Row Actions
When you hover your mouse over a row in the Model Mappings table, the following icons are displayed:
- Drill-Down Icon (⬇️): (If the field's Type is Object Field or Array of Objects) Reveals the attributes within the object or array. (See the "Navigating Nested Data" section below for more details.)
- Edit Icon (📝): Opens the Mapping Expression Editor, where you can edit the field's name, description, or mapping expression. (See the "Writing Mapping Expressions" documentation for more details on writing mapping expressions.)
- Delete Icon (🗑️): Removes the field from the configuration.
-
Add a Field (➕): Visible when you hover your mouse between to rows in the table, adds a new field to the table
Mapping Configuration Settings
Clicking the Settings button in the Mapping Editor header opens a pop-up where you can modify the following:
- Display Name: The configuration name is displayed in its box in the mapping graph.
- Coerce empty strings ('') to null: Any fields with an empty string value ('') will be converted to null when selected.
-
Remove null fields from Results preview and downstream outputs: When selected, any unmapped fields will be hidden from the output in the Results preview and will not be passed downstream of this mapping configuration.
Additional Mapping Editor Controls
-
Adding Fields:
- The Add Field ➕ icon at the top-right of the Model Mappings box adds a new field to the top of the table.
-
Reordering Fields:
- Click and drag the left edge of a row to reposition it within the table.
-
Filtering Fields:
- Click the 🔍 icon next to the Field Name column header and enter a search term to filter the table.
-
Editing Field Properties:
- Click the edit icon (📝) for a field to open the expression editor, where you can modify the field's name, description, and mapping expression.
- Click the DONE button to save changes and return to the mapping configuration table.
Navigating Nested Data
If a mapping configuration includes object or array fields, those fields will contain nested fields.
- Clicking the drill-down icon ⬇️ next to an array or object field will reveal its nested fields.
- The Results box will also update to show only the fields within the selected object or array.
- To return to the previous level, click the back button ⬅️ above the mapping table.
Understanding Output Configurations
To view the details of an output configuration:
- Click the box representing that output on the graph.
- The navigation is the same as the previous section above.
The Output screen contains the following components:
-
Header:
- Located at the top-right of the Output screen.
- Includes:
- Settings Icon: Opens a popup to edit the output's settings.
- Deploy Icon: Deploys any changes made to the output configuration.
- Size Selector: Allows users to adjust the height of the Output screen (25%, 50%, 75%, and 100% of the screen).
- Close Button: Exits the Output screen and returns to the mapping graph.
-
Source Data Box:
- Located on the left.
- Displays a sample source record.
-
Model Mappings Box:
- Located in the center.
- Shows all fields in the semantic model immediately upstream of the output.
-
Output Table Box:
- Located on the right.
- Displays the schema of the data warehouse destination table.
- Contains two columns:
- Field Name: The name, mode, and data type of each field in the destination table.
-
Value: The value that will be output to the destination for the source record displayed in the Source Data box, after all transformations.
Output Table Highlighting and Warnings
- In the Output Table, any destination field that is not mapped in the upstream mapping configuration is highlighted in gold.
- Any values in the Value column that do not match the field's data type will be indicated with a ⚠️ icon next to the field. Hover your mouse over the icon to view more information about the warning.
You can add and map missing output fields directly in the Mapping Editor box to the left of the Output Table. Once a missing field is added and mapped, it will no longer be highlighted in gold.
Output Settings
Clicking the Settings button in the Output screen header opens a popup where you can edit the following:
- Display Name: The name of the configuration, displayed on its box in the mapping graph.
- Iterator Expression: An optional setting used when outputting an array of objects, specifying how to enumerate the objects into individual output records.
-
Inclusion Filter: An optional setting to limit which records are output to the destination, along with a tool to check whether a source record will be included or excluded by the filter.
Understanding Edge Configurations
To view the details of an edge configuration:
- Click the yellow box representing that edge on the graph.
Clicking on an edge opens a popup above the edge with the following settings:
- Label: A name used to reference the upstream source or mapping configuration in a mapping configuration immediately downstream of the edge.
- Propagate Inputs: A checkbox that determines whether all fields from the upstream source or mapping output are passed to the downstream mapping or output configuration.
- Input Type: A setting that defines how new or updated records in the upstream mapping configuration affect the output of the downstream mapping configuration.
- To save an edge configuration, click the 💾 icon at the top-right corner of the popup.
- To discard changes and close the edge configuration, click the ❌ icon at the top-right corner of the popup.
Getting Started with Data Mapping
To begin mapping and outputting data, please review the following resources: