
Connect to a Data Source
Sources · Updated August 21, 2025
Introduction
This document provides a comprehensive guide to connecting to data sources within the Reactor platform. Connecting to data sources is the initial step in establishing a data pipeline, enabling Reactor to ingest, transform, and deliver data for analysis and other purposes. This guide outlines the step-by-step procedure for connecting to a data source and provides essential information for configuring the connection.
Accessing the Reactor Platform
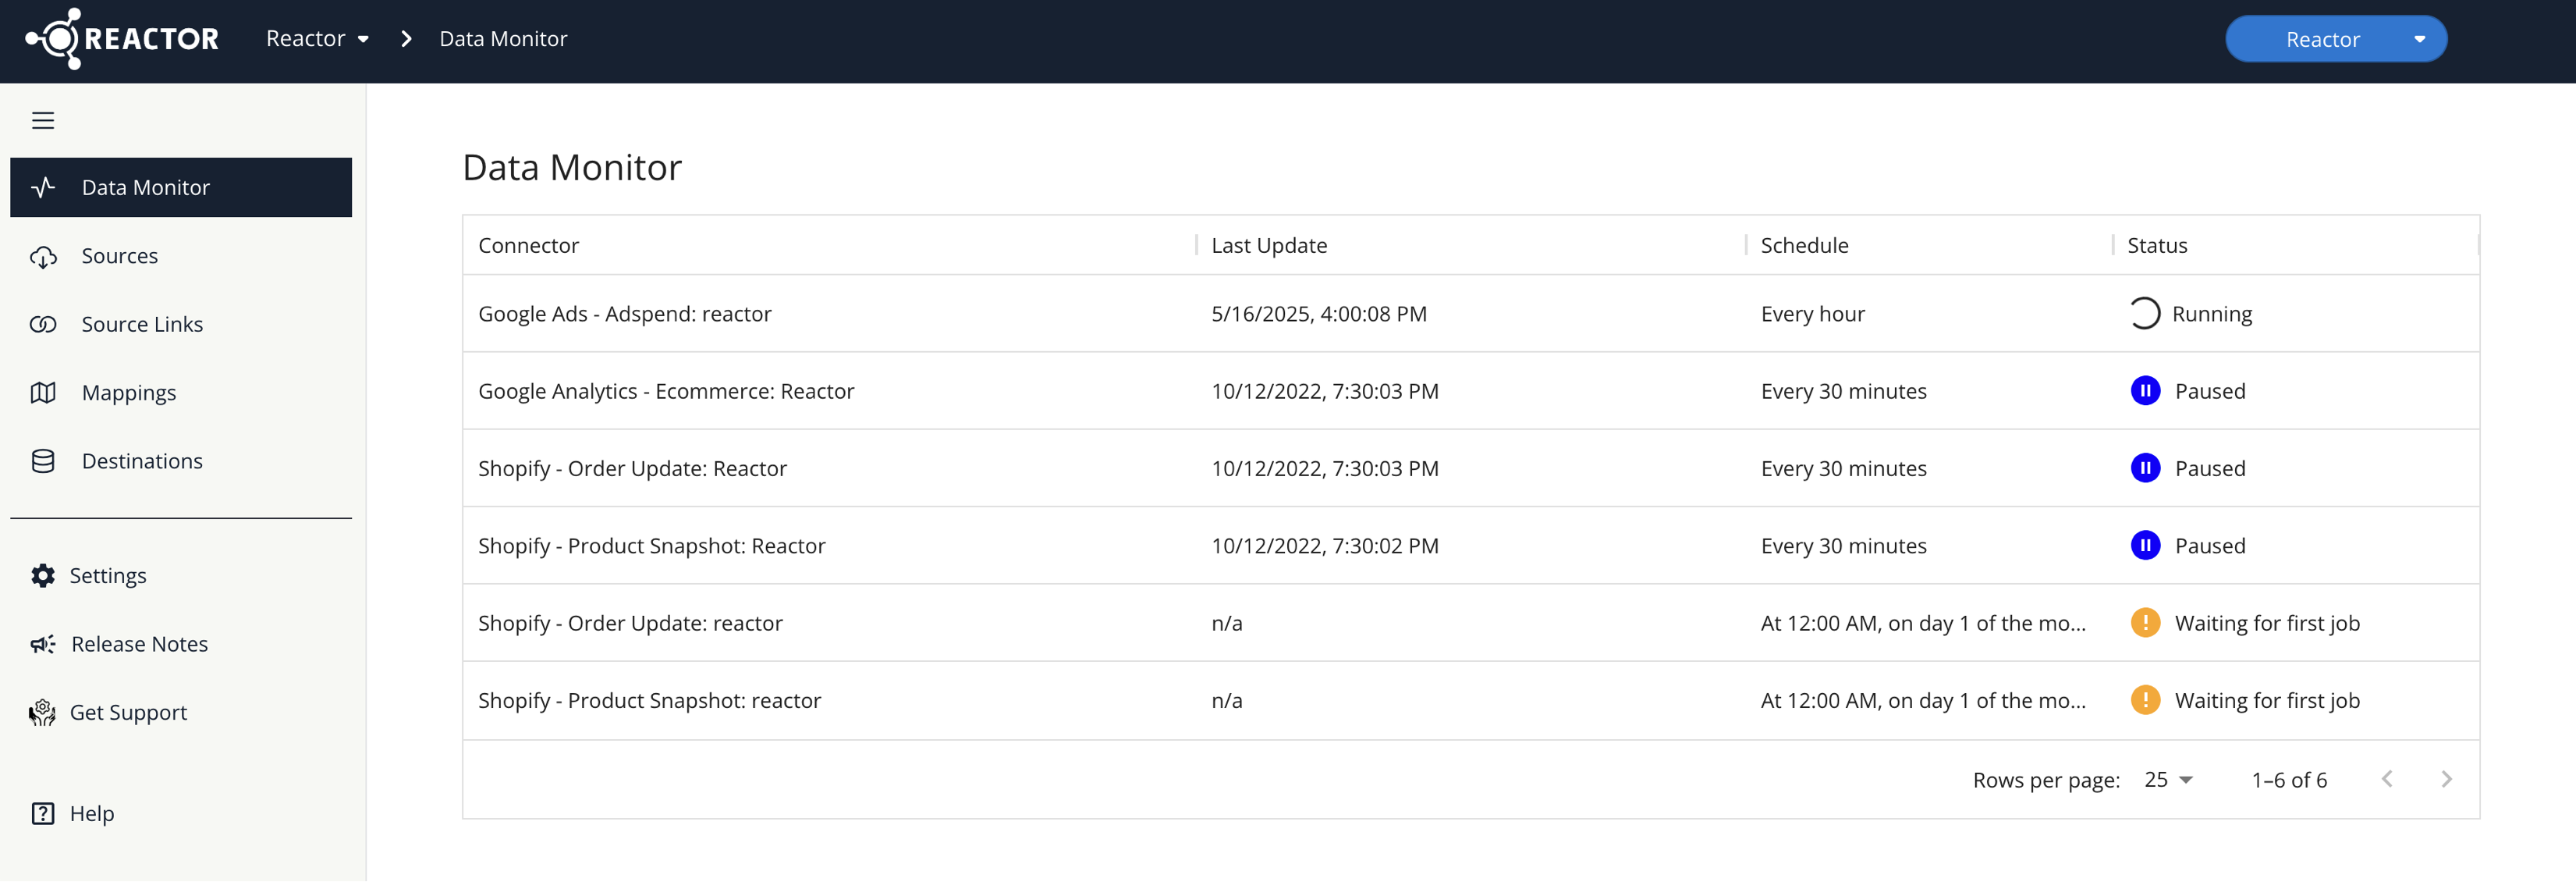
To begin, navigate to the Reactor platform by:
- Logging in: https://app.reactordata.com/
- You will land on the Data Monitor page unless you have logged in previously, then you land on the last page you were on before logging out.
Navigating to the Sources Screen
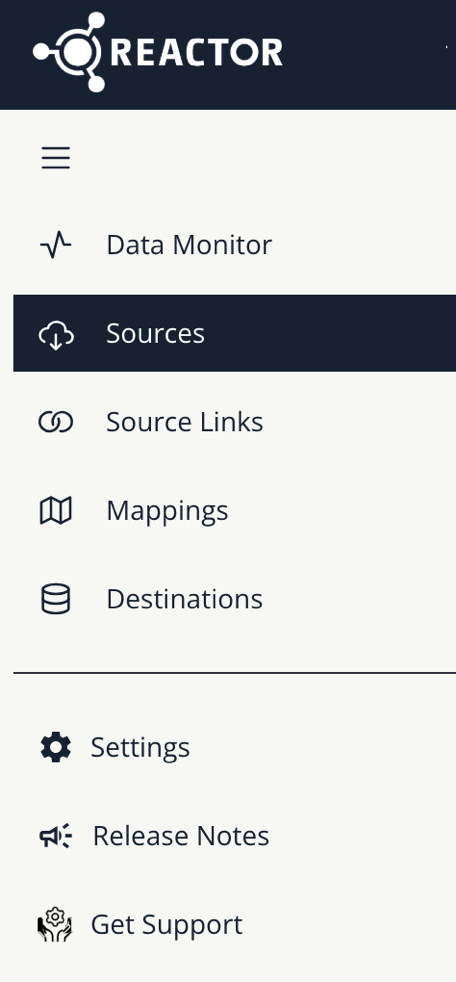
Once in the Reactor platform, access the data source management area by:
- Selecting "Sources" on the left sidebar.
Adding a New Data Source
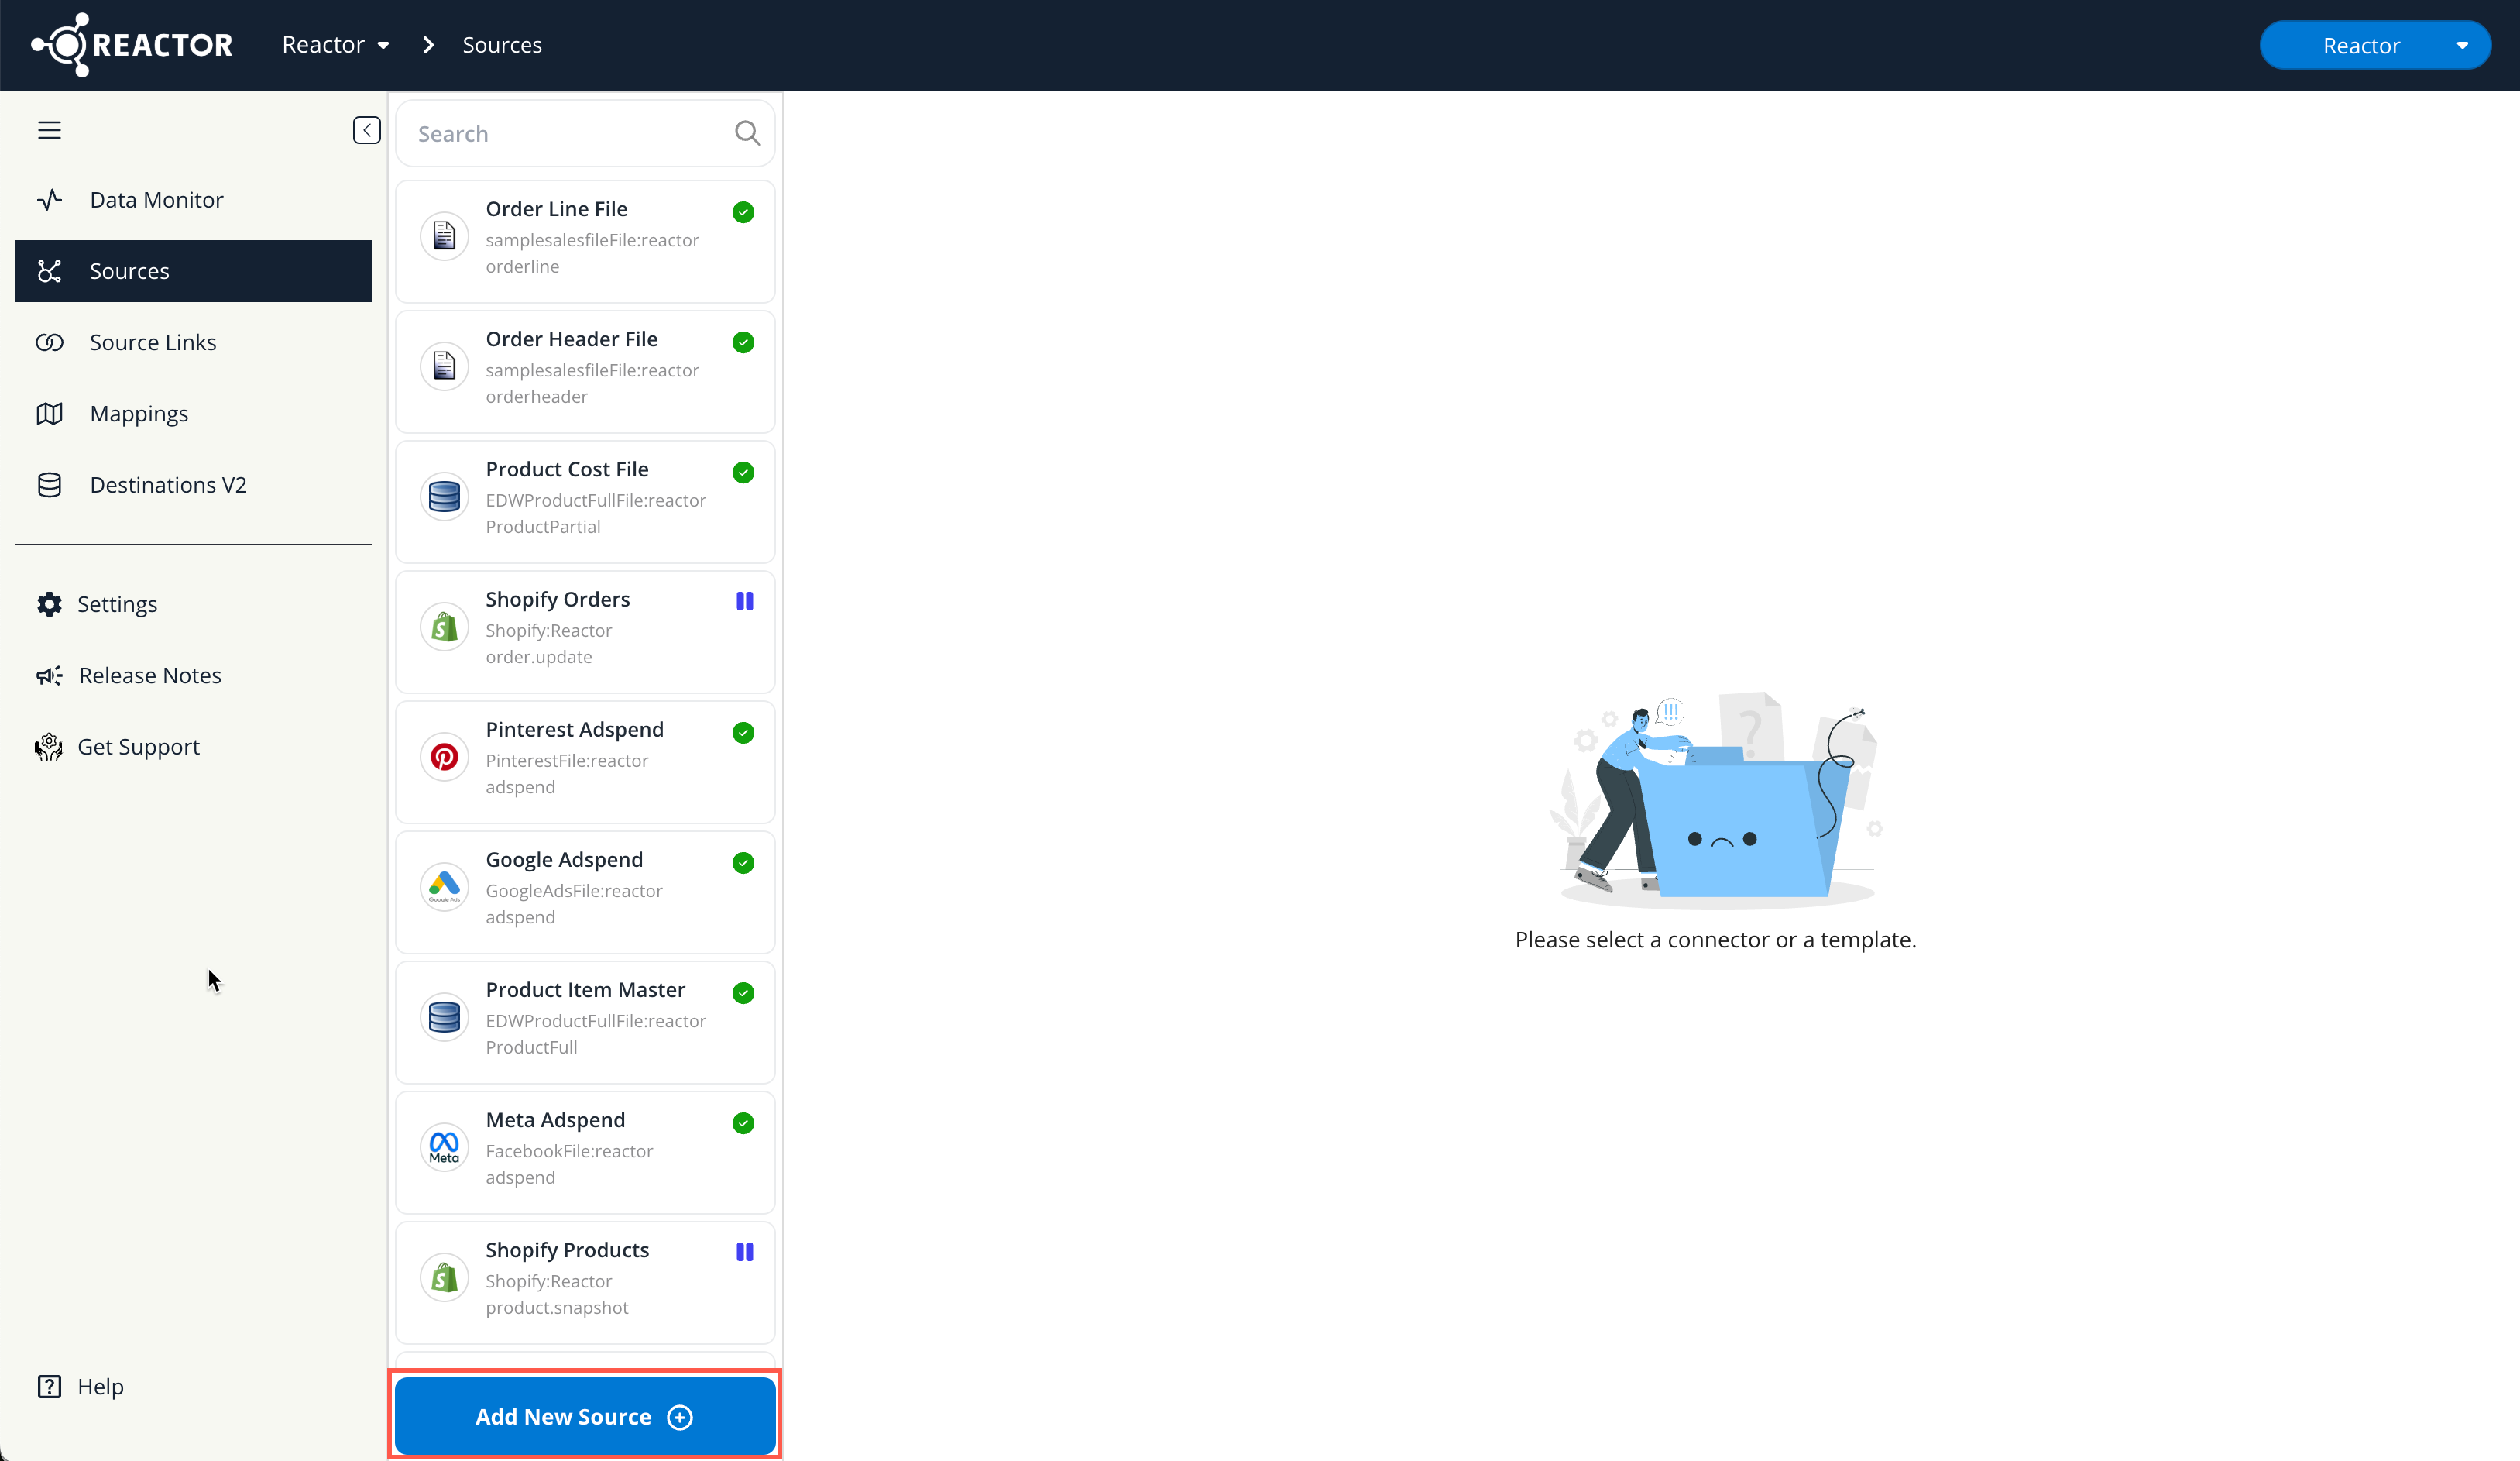
To initiate the process of connecting to a new data source:
- Select "Add New Source" located in the lower-left corner of the screen.
This action will trigger a pop-up window, prompting you to search for the desired source.
Searching for a Data Source
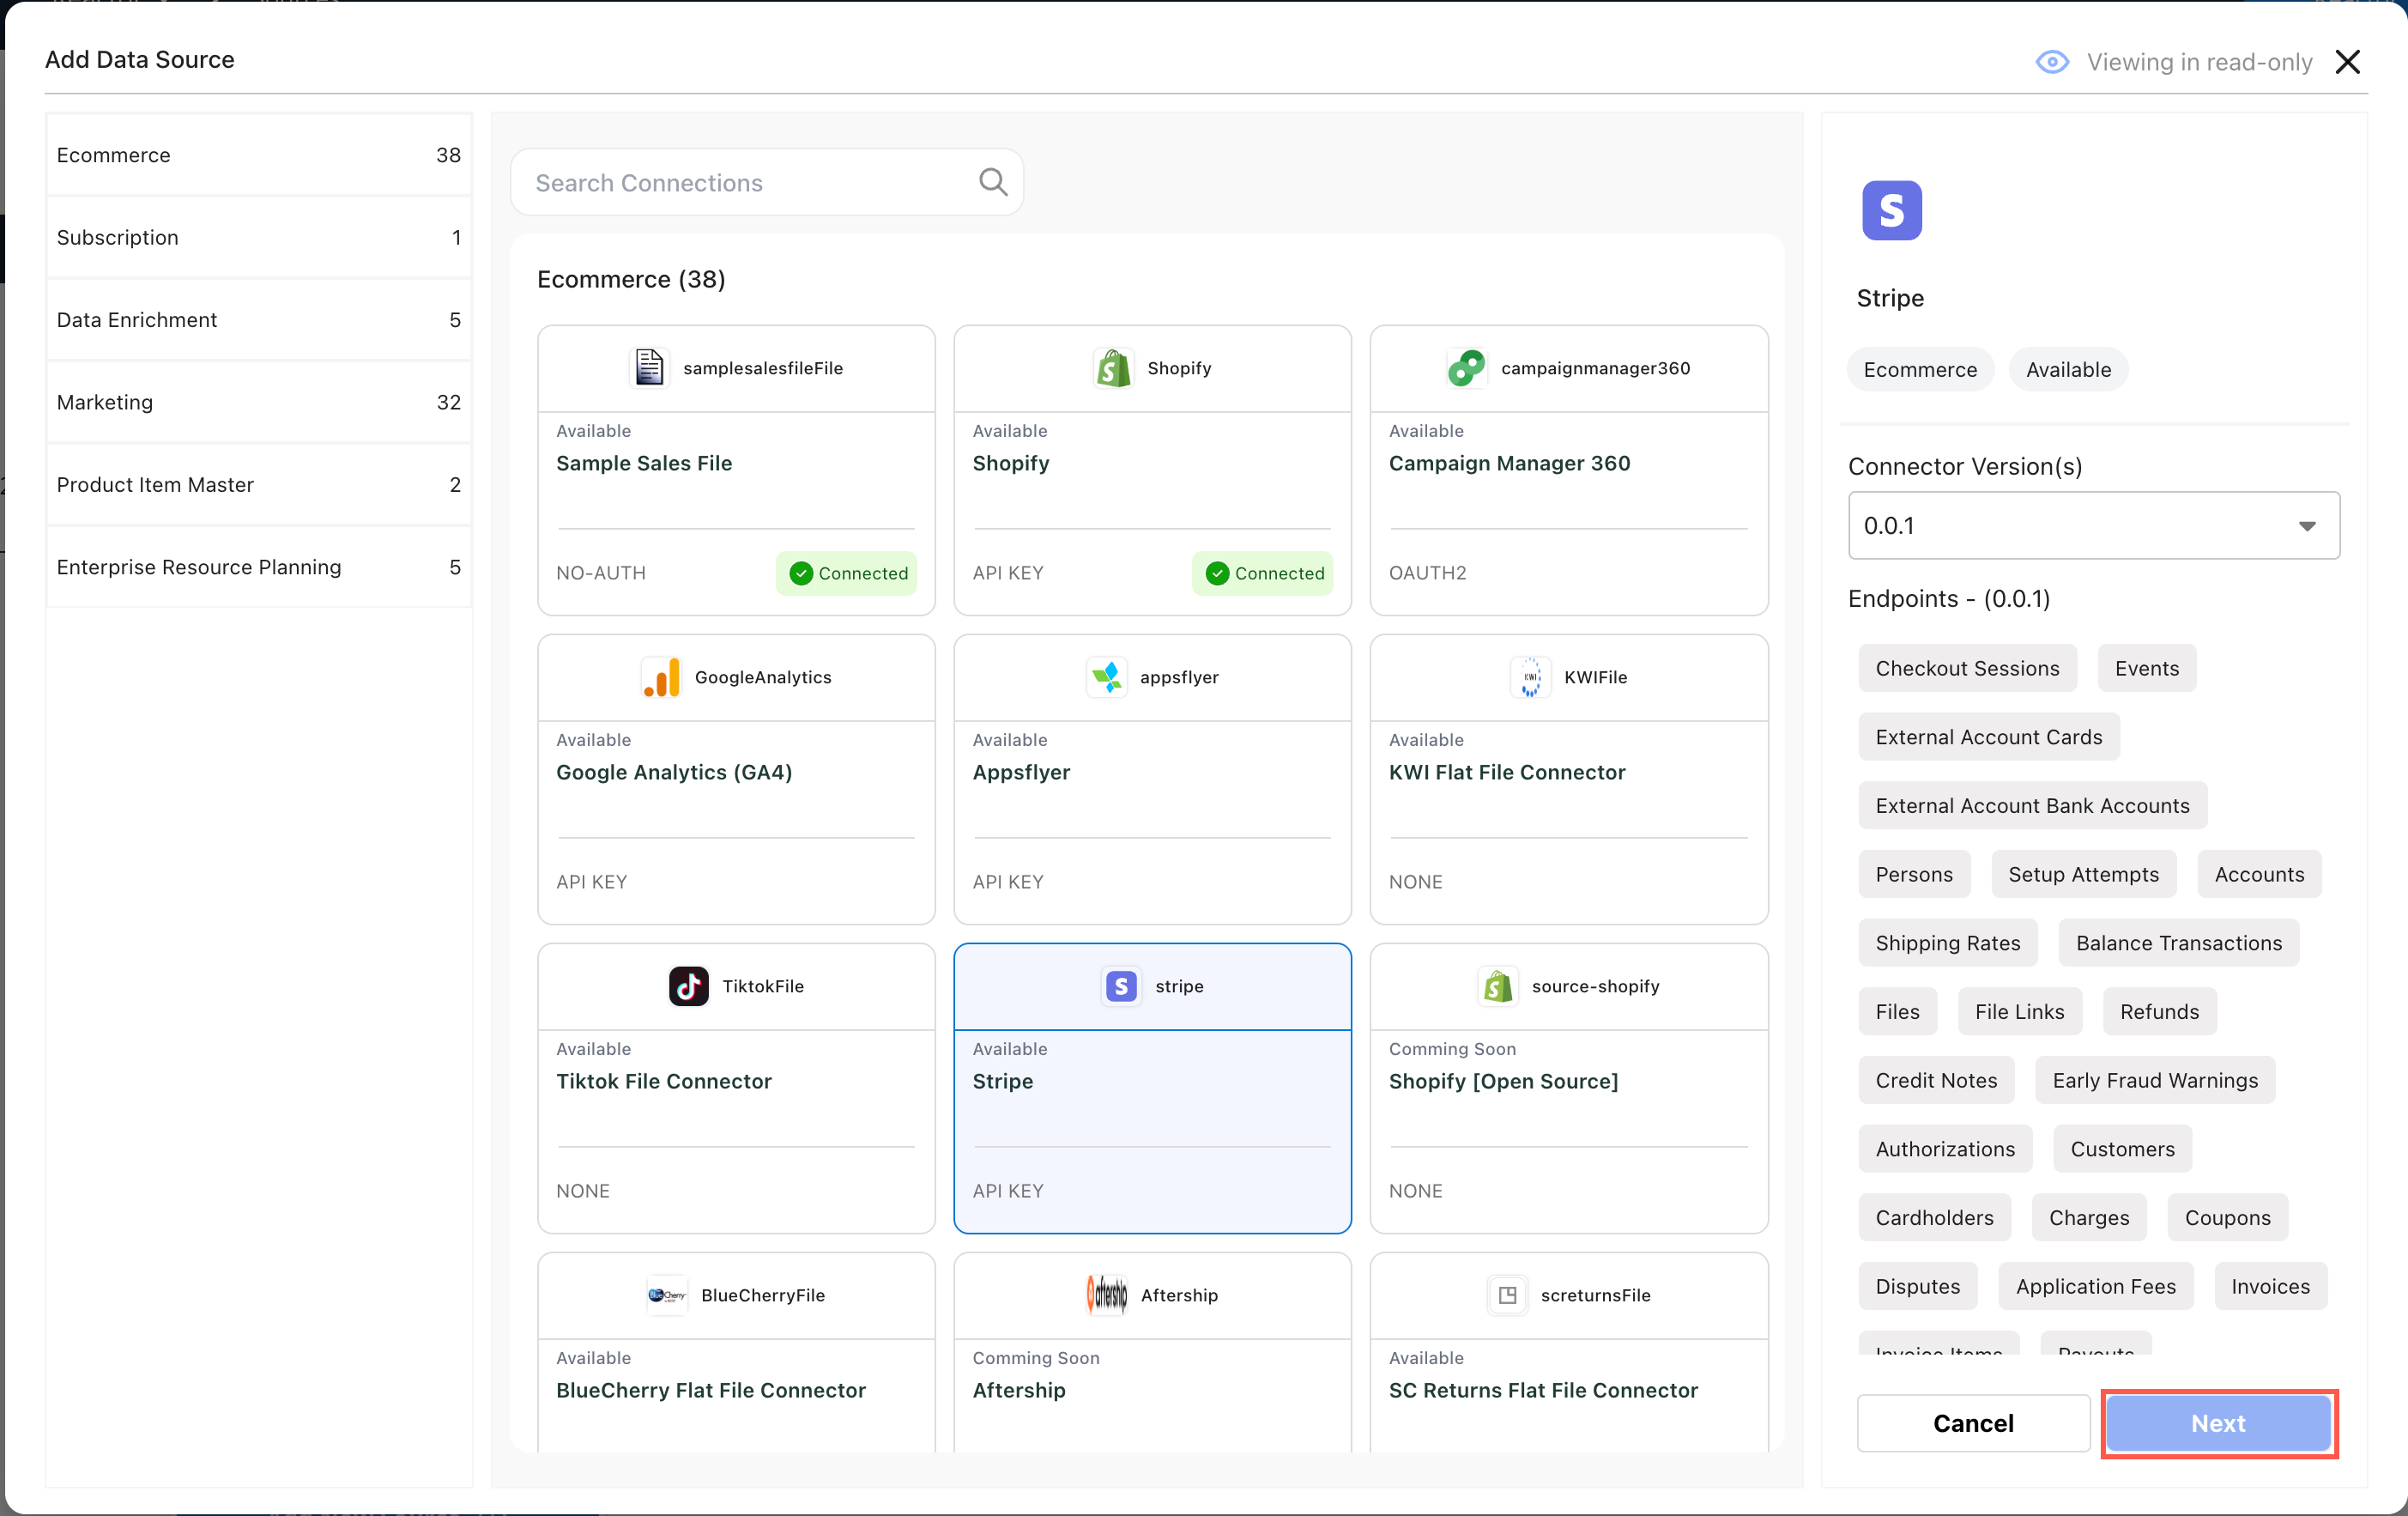
Within the pop-up window, locate the desired data source using one of the following methods:
- Search bar: Utilize the search bar at the top of the pop-up to enter keywords related to the source.
- Category tiles: Select the category tiles on the left side of the pop-up to filter the list of available connectors.
Once you have identified the source, proceed by:
- Clicking on the specific source you wish to add.
- Selecting the "Next" button, typically located at the bottom-right corner of the pop-up.
Configuring the Data Source Connection
Upon selecting "Next," a configuration wizard will appear, replacing the pop-up window. This wizard guides you through the necessary steps to set up the connector.
The configuration process generally involves the following steps:
Step 1—Connector Configuration:
- In this step, specify the version and endpoint for the connector you are deploying.
- Define a "Scope" and "Display Name" for this particular connector instance.
- The "Display Name" is crucial for identifying the source connector in the Source Links and Mappings pages. Ensure it is descriptive and easily distinguishable from other connectors.
- The "Scope" is a label used to categorize data, often corresponding to a brand, business unit, or store. It helps differentiate data originating from the same source and endpoint.
Step 2—Parameter Configuration:
-
- This step involves defining parameters that are specific to the selected data source.
- Tooltips are generally provided below each parameter field to offer context and guidance on its meaning and usage.
Step 3—Authentication Configuration:
-
- In this step, provide the necessary credentials required to authenticate with the data source. This may include usernames, passwords, API keys, or other authentication methods.
Step 4—Schedule Configuration:
-
- Define the schedule for data collection from the source.
- You can typically select a pre-defined schedule from a dropdown menu or specify a custom schedule using the cron format.
Deploying the Connector
After completing all the required connection settings within the configuration wizard:
- Select the "Deploy" button, usually located at the bottom-right of the wizard.
Reactor will then start the process of collecting data from the source, following the data collection schedule you have set.
Viewing Sample Source Data
After successfully deploying the connector and ensuring that it has begun collecting data from the source:
- Navigate to the "Data Preview" tab, typically located at the top of the screen.
This tab provides a tabular view of a sample of the source's data, allowing you to verify the connection and data structure.
Filtering the Data Preview
To refine the data displayed in the Data Preview:
- Select the filter icon and select which fields you want to view to filter the view by specific fields.
Accessing Full Row Preview
For a more detailed view of individual data records:
- Hover over the left edge of a row in the table. A "▶️" icon will appear.
- Select this icon to display a full preview of the selected row in JSON format.
Data Availability
It's worth noting that the connector may not appear immediately in the Data Monitor screen. The connector will become visible in the Data Monitor once the initial data collection run has started, as scheduled in Step 4 (Schedule Configuration).
Next Steps
Once the connector has initiated data collection, you can proceed with configuring the Identity Setup and Data Standard for the source. For detailed instructions on these steps, please refer to the "Standardize Your Source Data" documentation.